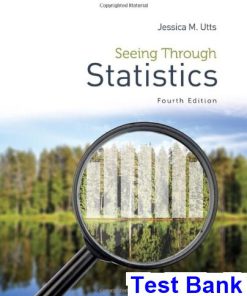
Seeing Through Statistics 4th Edition Utts Solutions Manual
$50.00 Original price was: $50.00.$26.50Current price is: $26.50.
Seeing Through Statistics 4th Edition Utts Solutions Manual.
Instant download Seeing Through Statistics 4th Edition Utts Solutions Manual pdf docx epub after payment.

Product Details:
- ISBN-10 : 1285050886
- ISBN-13 : 978-1285050881
- Author: Jessica M. Utts
Table of contents:
- Part 1: Finding Data in Life
- Chapter 1: The Benefits and Risks of Using Statistics
- 1.1 Why Bother Reading This Book?
- 1.2 What is Statistics All About?
- 1.3 Detecting Patterns and Relationships
- 1.4 Don’t Be Deceived by Improper Use of Statistics
- 1.5 Summary and Conclusions
- Exercises
- Mini-Projects
- References
- Chapter 2: Reading the News
- 2.1 The Educated Consumer of Data
- 2.2 Origins of News Stories
- 2.3 How to Be a Statistics Sleuth: Seven Critical Components
- 2.4 Four Hypothetical Examples of Bad Reports
- 2.5 Planning Your Own Study: Defining the Components in Advance
- Exercises
- Mini-Projects
- References
- Chapter 3: Measurements, Mistakes, and Misunderstandings
- 3.1 Simple Measures Don’t Exist
- 3.2 It’s All in the Wording
- 3.3 Open or Closed Questions: Should Choices Be Given?
- 3.4 Defining What Is Being Measured
- 3.5 Defining a Common Language
- Exercises
- Mini-Projects
- References
- Chapter 4: How to Get a Good Sample
- 4.1 Common Research Strategies
- 4.2 Defining a Common Language
- 4.3 The Beauty of Sampling
- 4.4 Simple Random Sampling
- 4.5 Other Sampling Methods
- 4.6 Difficulties and Disasters in Sampling
- Exercises
- Mini-Projects
- References
- Chapter 5: Experiments and Observational Studies
- 5.1 Defining a Common Language
- 5.2 Designing a Good Experiment
- 5.3 Difficulties and Disasters in Experiments
- 5.4 Designing a Good Observational Study
- 5.5 Difficulties and Disasters in Observational Studies
- 5.6 Random Sample versus Random Assignment
- Exercises
- Mini-Projects
- References
- Chapter 6: Getting the Big Picture
- 6.1 Final Questions
- Mini-Projects
- References
- Part 2: Finding Life in Data
- Chapter 7: Summarizing and Displaying Measurement Data
- 7.1 Turning Data into Information
- 7.2 Picturing Data: Stemplots and Histograms
- 7.3 Five Useful Numbers: A Summary
- 7.4 Boxplots
- 7.5 Traditional Measures: Mean, Variance, and Standard Deviation
- 7.6 Caution: Being Average Isn’t Normal
- Exercises
- Mini-Projects
- References
…
People Also Search:
seeing through statistics 4th edition answers
seeing through statistics 3rd edition
how much of what you see is a hallucination
what counts as a statistic
what is the observed statistic
what is a relevant statistic
is seeing spots normal
what does c represent in statistics
e value statistics
how to get through statistics class
what does j mean in statistics
Instant download after Payment is complete
You may also like…
Solutions Manual
Solutions Manual
Essentials Of Statistics 4th Edition Triola Solutions Manual
Solutions Manual
Introductory Statistics Exploring the World Through Data 1st Edition Gould Solutions Manual
Solutions Manual
Australasian Business Statistics 4th Edition black Solutions Manual
Solutions Manual
Related products
Solutions Manual
Test Bank
Solutions Manual
Algebra A Combined Approach 4th Edition Gay Solutions Manual
Test Bank
Basic and Applied Concepts of Blood Banking and Transfusion Practices 4th Edition Howard Test Bank


