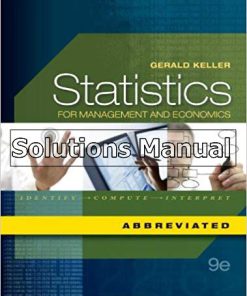
Statistics For Management And Economics 9th Edition Keller Solutions Manual
$50.00 Original price was: $50.00.$26.50Current price is: $26.50.
Statistics For Management And Economics 9th Edition Keller Solutions Manual.
This is completed downloadable of Statistics For Management And Economics 9th Edition Keller Solutions Manual
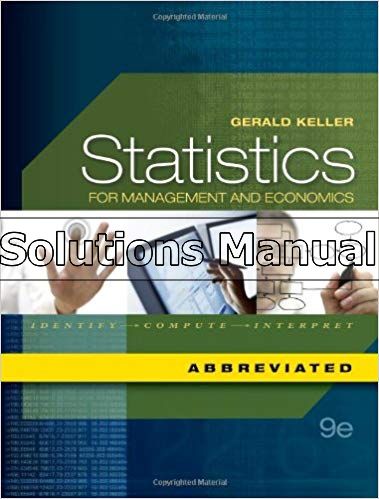
Product Details:
- ISBN-10 : 0538477490
- ISBN-13 : 978-0538477499
- Author: Gerald Keller
Statistics for Management & Economics Keller, Gerald
Table of Content:
Chapter 1:
(a)
Population: A population is set of all objects or persons or items of interest.
Example:
The number of persons in a city is a population representing the whole population in the city.
(b)
Sample: A sample is a sub set of the population or in other words sample is a part of the population.
Example:
As considered in the part (a) from a city if a part of the persons in the city is considered for our requirement is called a sample.
(c)
Parameter: A descriptive measure of the population is called a statistic or in other words parameter is constant representing a population characteristic.
Example:
If a population representing the heights of a country then the mean height of persons in the country is a parameter.
(d)
Statistic: A descriptive measure of the sample is called a statistic or in other words a statistic is a constant representing the characteristic of a sample.
Example:
From a school having 500 students we consider 30 students for an opinion collection regarding the standards of the school, then we consider the
(e)
Statistical inference: Statistical inference is the process of making an estimate prediction or decision about a population based on sample data.
In any research; studying the population is very time consuming and expensive to study all the objects in the population, so we consider a part of the population as a sample and study all the objects in the sample and the numerical measure obtained from the sample is defined as an estimate of the population parameter. Based on the sample statistic we consider the statistic as an estimate of the population parameter. The decision regarding the population is considered based on the sample data is called the prediction of the data.
Example: To study whether the coin is biased or not. We consider a sample of 100 numbers of flips of a coin. Here, the sample is the number of flips of a coin. And the statistic is the proportion of heads, as the population parameter is proportion of heads is ½. Let our samples results shows that is out of 100 trails we have 65 heads. Therefore, we can say that the coin is not an unbiased coin. That is the sample statistic is used as an estimate of the population proportion of the proportion of heads.
Chapter 2:
The values of nominal data are categories. For example, responses to questions about martial status produce nominal data. The values of this variable are single, married divorced, and widowed. We often record nominal data by arbitrary assigning a number to each category. For example, we could record martial status using the following codes:
Single = 1, married=2, divorced=3, widowed = 4.
The Ordinal data appear to be nominal, but the difference is that the order of their values has meaning. For example, at the completion of most college and university courses, students are asked to evaluate the course.
Five students are ranked 1, 2,3,4,5 in that order according to their performances. One can say that the student with rank 1 is better than a student with rank 2 but it is not known how better student 1 is.
Interval data are real numbers, such as heights, weights, incomes, and distances. We also refer to this type of data as quantitative or numerical. Other examples of interval scale are sea level, intelligent scores, etc.
People Also Search:
statistics for management and economics keller
statistics for management and economics 9th edition keller
statistics for management and economics 9th edition download scribd
statistics for management and economics 9th edition solution manual download pdf
statistics for management and economics
statistics for management and economics 9th edition
keller statistics
Instant download after Payment is complete
You may also like…
Management
Statistics for Management and Economics Abbreviated 10th Edition Gerald Keller Solutions Manual
Related products
Solutions Manual
Solutions Manual
Solutions Manual
A+ Guide to IT Technical Support Hardware and Software 9th Edition Andrews Solutions Manual
Solutions Manual
Solutions Manual
Accounting An Introduction 6th Edition Atrill Solutions Manual
Solutions Manual
Accounting Business Reporting for Decision Making 6th Edition Birt Solutions Manual
Solutions Manual


