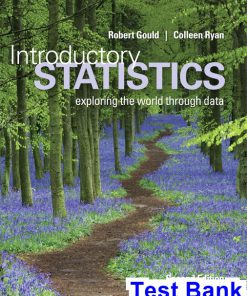
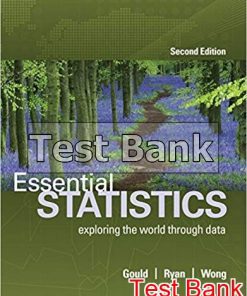
Introductory Statistics Exploring the World Through Data 1st Edition Gould Test Bank
$50.00 Original price was: $50.00.$26.50Current price is: $26.50.
Introductory Statistics Exploring the World Through Data 1st Edition Gould Test Bank.
Introductory Statistics Exploring the World Through Data 1st Edition Gould Test Bank
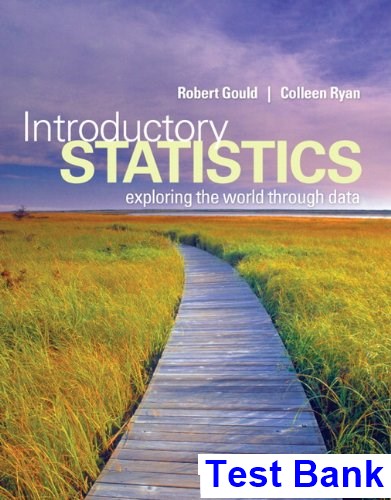
Product details:
- ISBN-10 : 013518892X
- ISBN-13 : 978-0135188927
- Author: Robert L. Gould
Embracing these characteristics, Introductory Statistics teaches students how to explore and analyze real data to answer real-world problems. Crafted by authors who are active in the classroom and in the statistics education community, the 3rd Edition pairs a clear, conversational writing style with new and frequent opportunities to apply statistical thinking. Its tone and learning aids are designed to equip any student to analyze, interpret, and tell a story about modern data, regardless of the student’s mathematical proficiency.
Table contents:
1: Introduction to Data
1.1 What Are Data?1.2 Classifying and Storing Data1.3 Investigating Data1.4 Organizing Categorical Data1.5 Collecting Data to Understand Causality
2: Picturing Variation with Graphs
2.1 Visualizing Variation in Numerical Data2.2 Summarizing Important Features of a Numerical Distribution2.3 Visualizing Variation in Categorical Variables2.4 Summarizing Categorical Distributions2.5 Interpreting Graphs
3: Numerical Summaries of Center and Variation
3.1 Summaries for Symmetric Distributions3.2 What’s Unusual? The Empirical Rule and z-Scores3.3 Summaries for Skewed Distributions3.4 Comparing Measures of Center3.5 Using Boxplots for Displaying Summaries
4: Regression Analysis: Exploring Associations between Variables
4.1 Visualizing Variability with a Scatterplot4.2 Measuring Strength of Association with Correlation4.3 Modeling Linear Trends4.4 Evaluating the Linear Model
5: Modeling Variation with Probability
5.1 What Is Randomness?5.2 Finding Theoretical Probabilities5.3 Associations in Categorical Variables5.4 Finding Empirical Probabilities
6: Modeling Rando Events: The Normal and Binomial Models
6.1 Probability Distributions Are Models of Random Experiments6.2 The Normal Model6.3 The Binomial Model (Optional)
7: Survey Sampling and Inference
7.1 Learning about the World through Surveys7.2 Measuring the Quality of a Survey7.3 The Central Limit Theorem for Sample Proportions7.4 Estimating the Population Proportion with Confidence Intervals7.5 Comparing Two Population Proportions with Confidence
8: Hypothesis Testing for Population Proportions
8.1 The Essential Ingredients of Hypothesis Testing8.2 Hypothesis Testing in Four Steps8.3 Hypothesis Tests in Detail8.4 Comparing Proportions from Two Populations
9: Inferring Population Means
9.1 Sample Means of Rando Samples9.2 The Central Limit Theorem for Sample Means9.3 Answering Questions about the Mean of a Population9.4 Hypothesis Testing for Means9.5 Comparing Two Population Means9.6 Overview of Analyzing Means
10: Associations between Categorical Variables
10.1 The Basic Ingredients for Testing with Categorical Variables10.2 The Chi-Square Test for Goodness of Fit10.3 Chi-Square Tests for Associations between Categorical Variables10.4 Hypothesis Tests When Sample Sizes Are Small
11: Multiple Comparisons and Analysis of Variance
11.1 Multiple Comparisons11.2 The Analysis of Variance11.3 The ANOVA Test11.4 Post-Hoc Procedures
12: Experimental Design: Controlling Variation
12.1 Variation Out of Control12.2 Controlling Variation in Surveys12.3 Reading Research Papers
13: Inference without Normality
13.1 Transforming Data13.2 The Sign Test for Paired Data13.3 Mann-Whitney Test for Two Independent Groups13.4 Randomization Tests
14: Inference for Regression
14.1 The Linear Regression Model14.2 Using the Linear Model14.3 Predicting Values and Estimating Means
People also search:
introductory statistics exploring the world through data
introductory statistics 10th edition
introductory statistics
introductory statistics pdf free
introductory statistics download scribd
Instant download after Payment is complete
You may also like…
Solutions Manual
Solutions Manual
Introductory Statistics Exploring the World Through Data 1st Edition Gould Solutions Manual
Solutions Manual
Canadian
Research Methods Exploring the Social World Canadian Canadian 1st Edition Diane Symbaluk Test Bank
Related products
Test Bank


